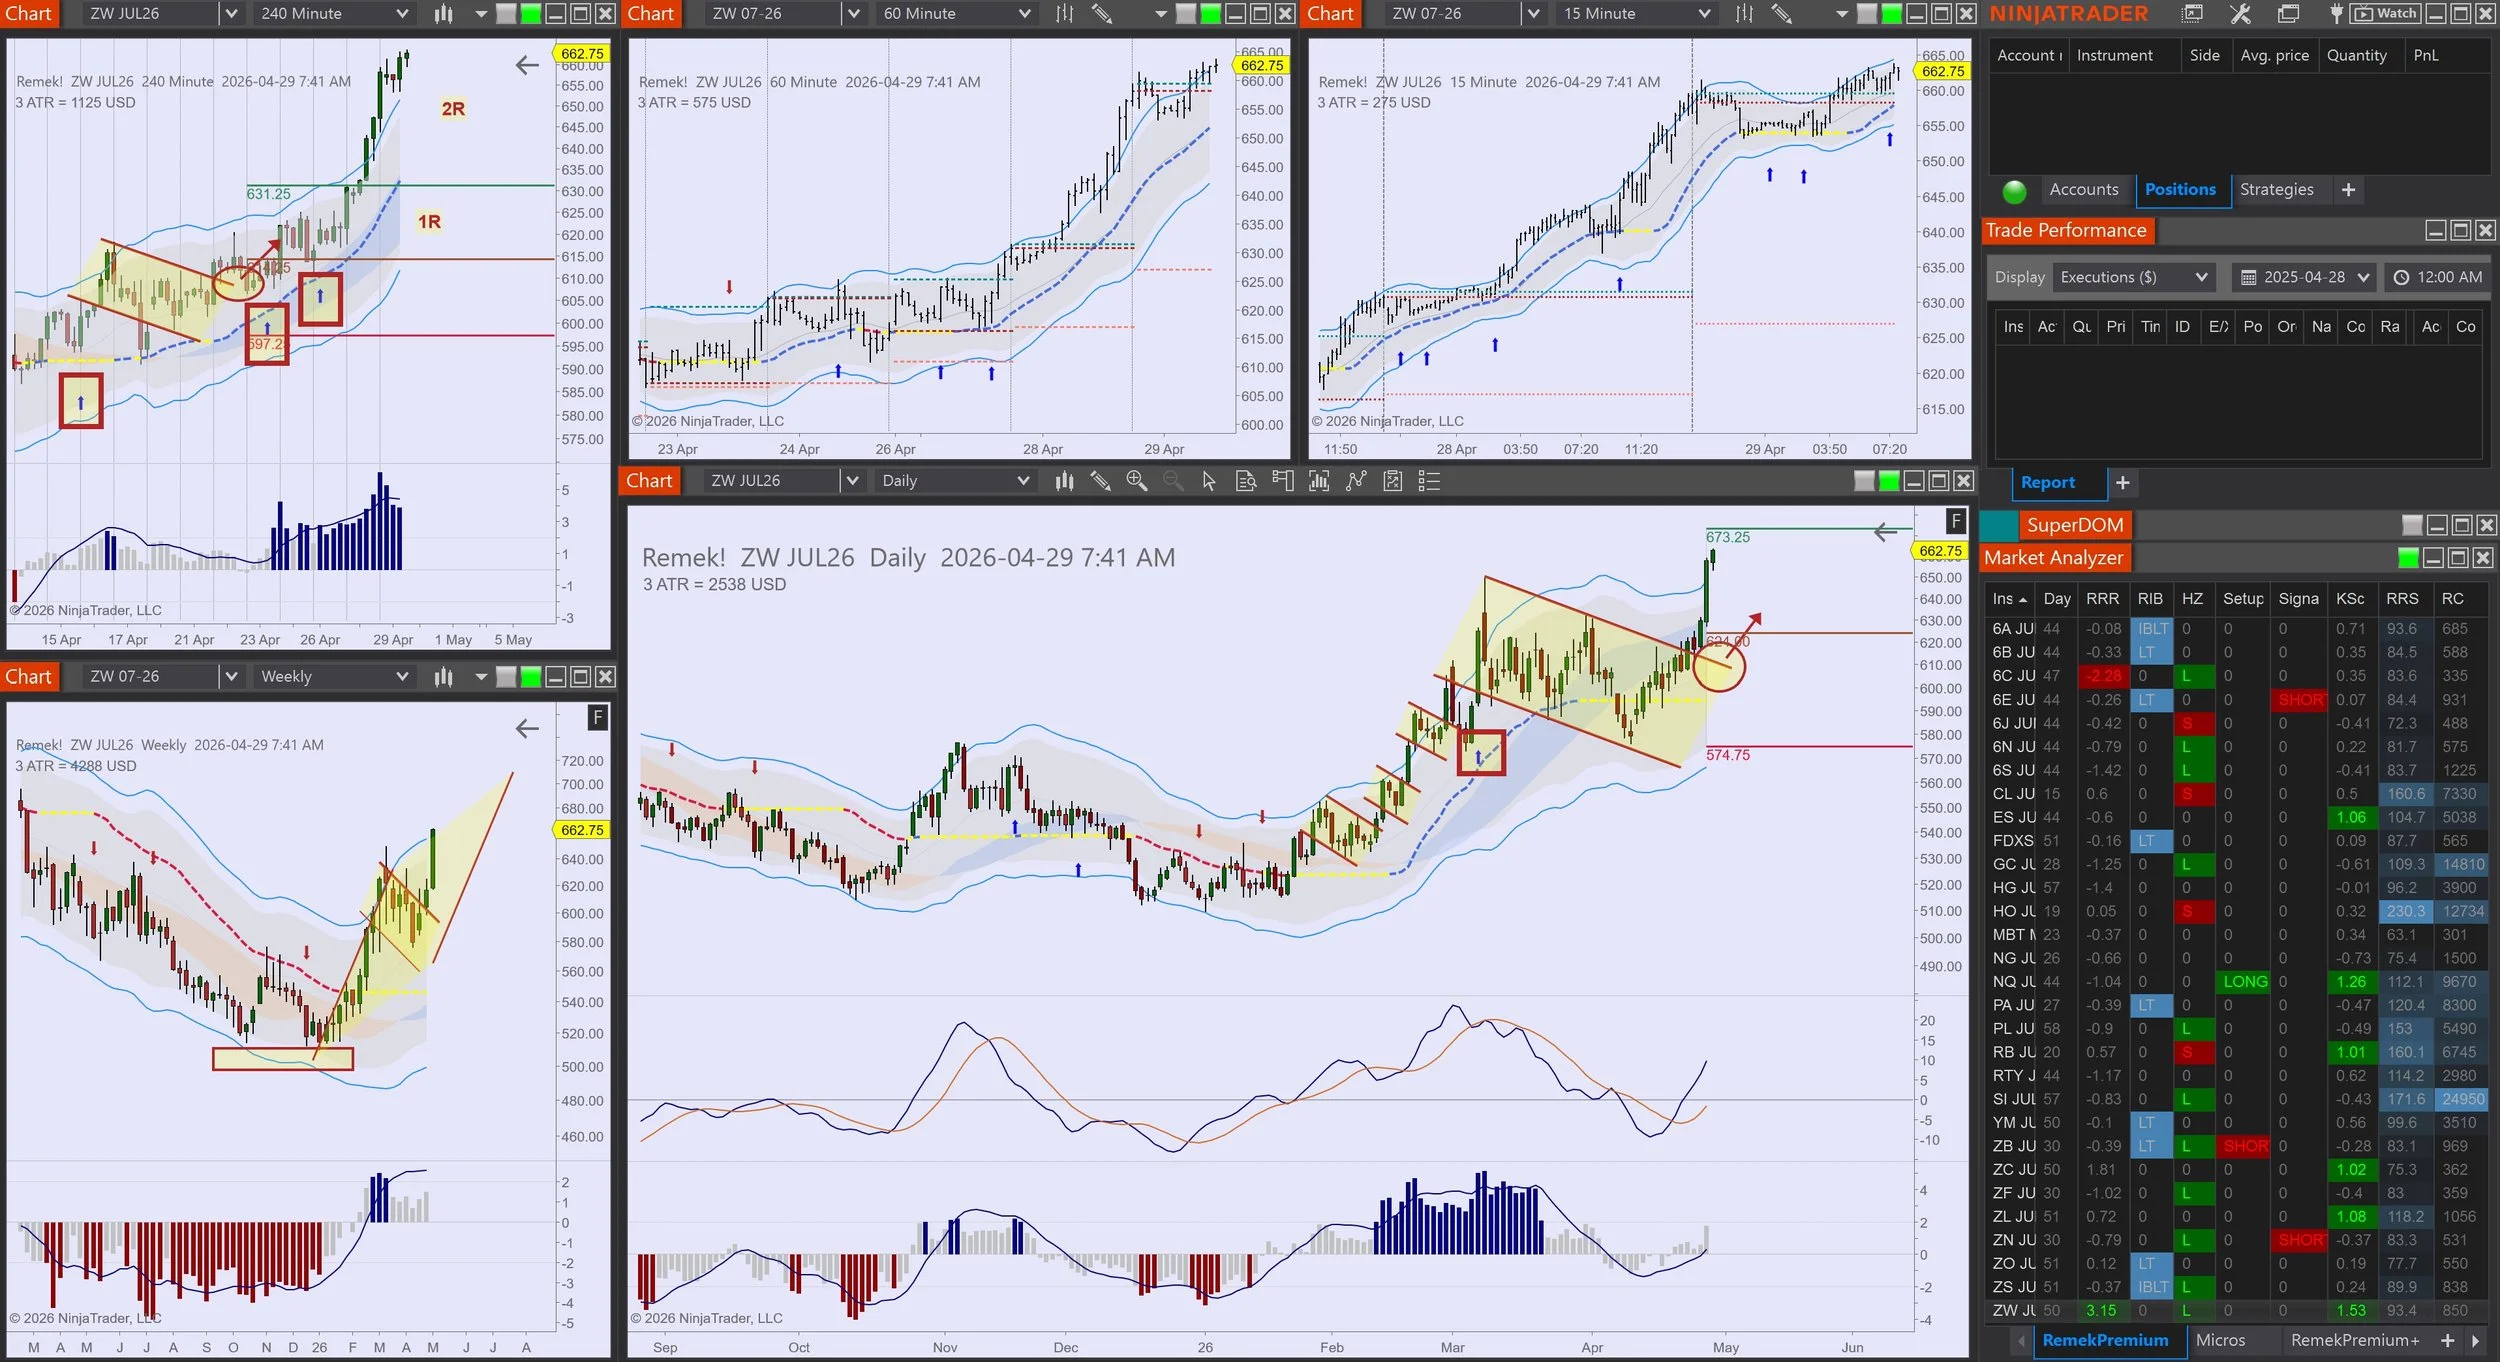
I wrote about using pattern failures as entries before. Look at 6B, and the bullflag forming on the daily timeframe. Looks easy, but of course, in trading nothing is easy. When will that bullflag turn? What is the best place to enter long?
Well, the lower timeframe, in this case the 4hr chart, can help. Of course, it’s all potential since we don’t know the future, but knowing what to be on the lookout for helps. So the question is: what event on the 4hr chart could help us time our entry into the daily pattern?
Well, as long as the daily is going down, it’s likely to be doing so by leaving bearflags in its wake on the lower timeframe. Which means, the first bearflag on the LTF that fails may just prove to be the clue to go long on the trading timeframe (in this case the daily). In other words, as long as the LTF bearflags manifest themselves, stay put with that bullflag on the daily. But the first bearflag that fails on the LTF should be seen as a headsup, and potential signal to enter the daily long.
Remember: opportunity goes hand in hand with risk. No one knows the future. (As we saw last week, sometimes a failed pattern can fail too.) Managing risk is always Job 1.
By the way, this important technique is not restricted to the daily/240m timeframe duo. If you trade intraday, you can try a 60m/15m or a 8000tick/3000tick or 30R/10R, or some other timeframe pair that you find useful on your traded instrument and on your traded timeframe.
Mindful trading!
PS: 10.38am Eastern - the entry. See chart to the right
Talking about potential bearflags, this may be another one in the works: