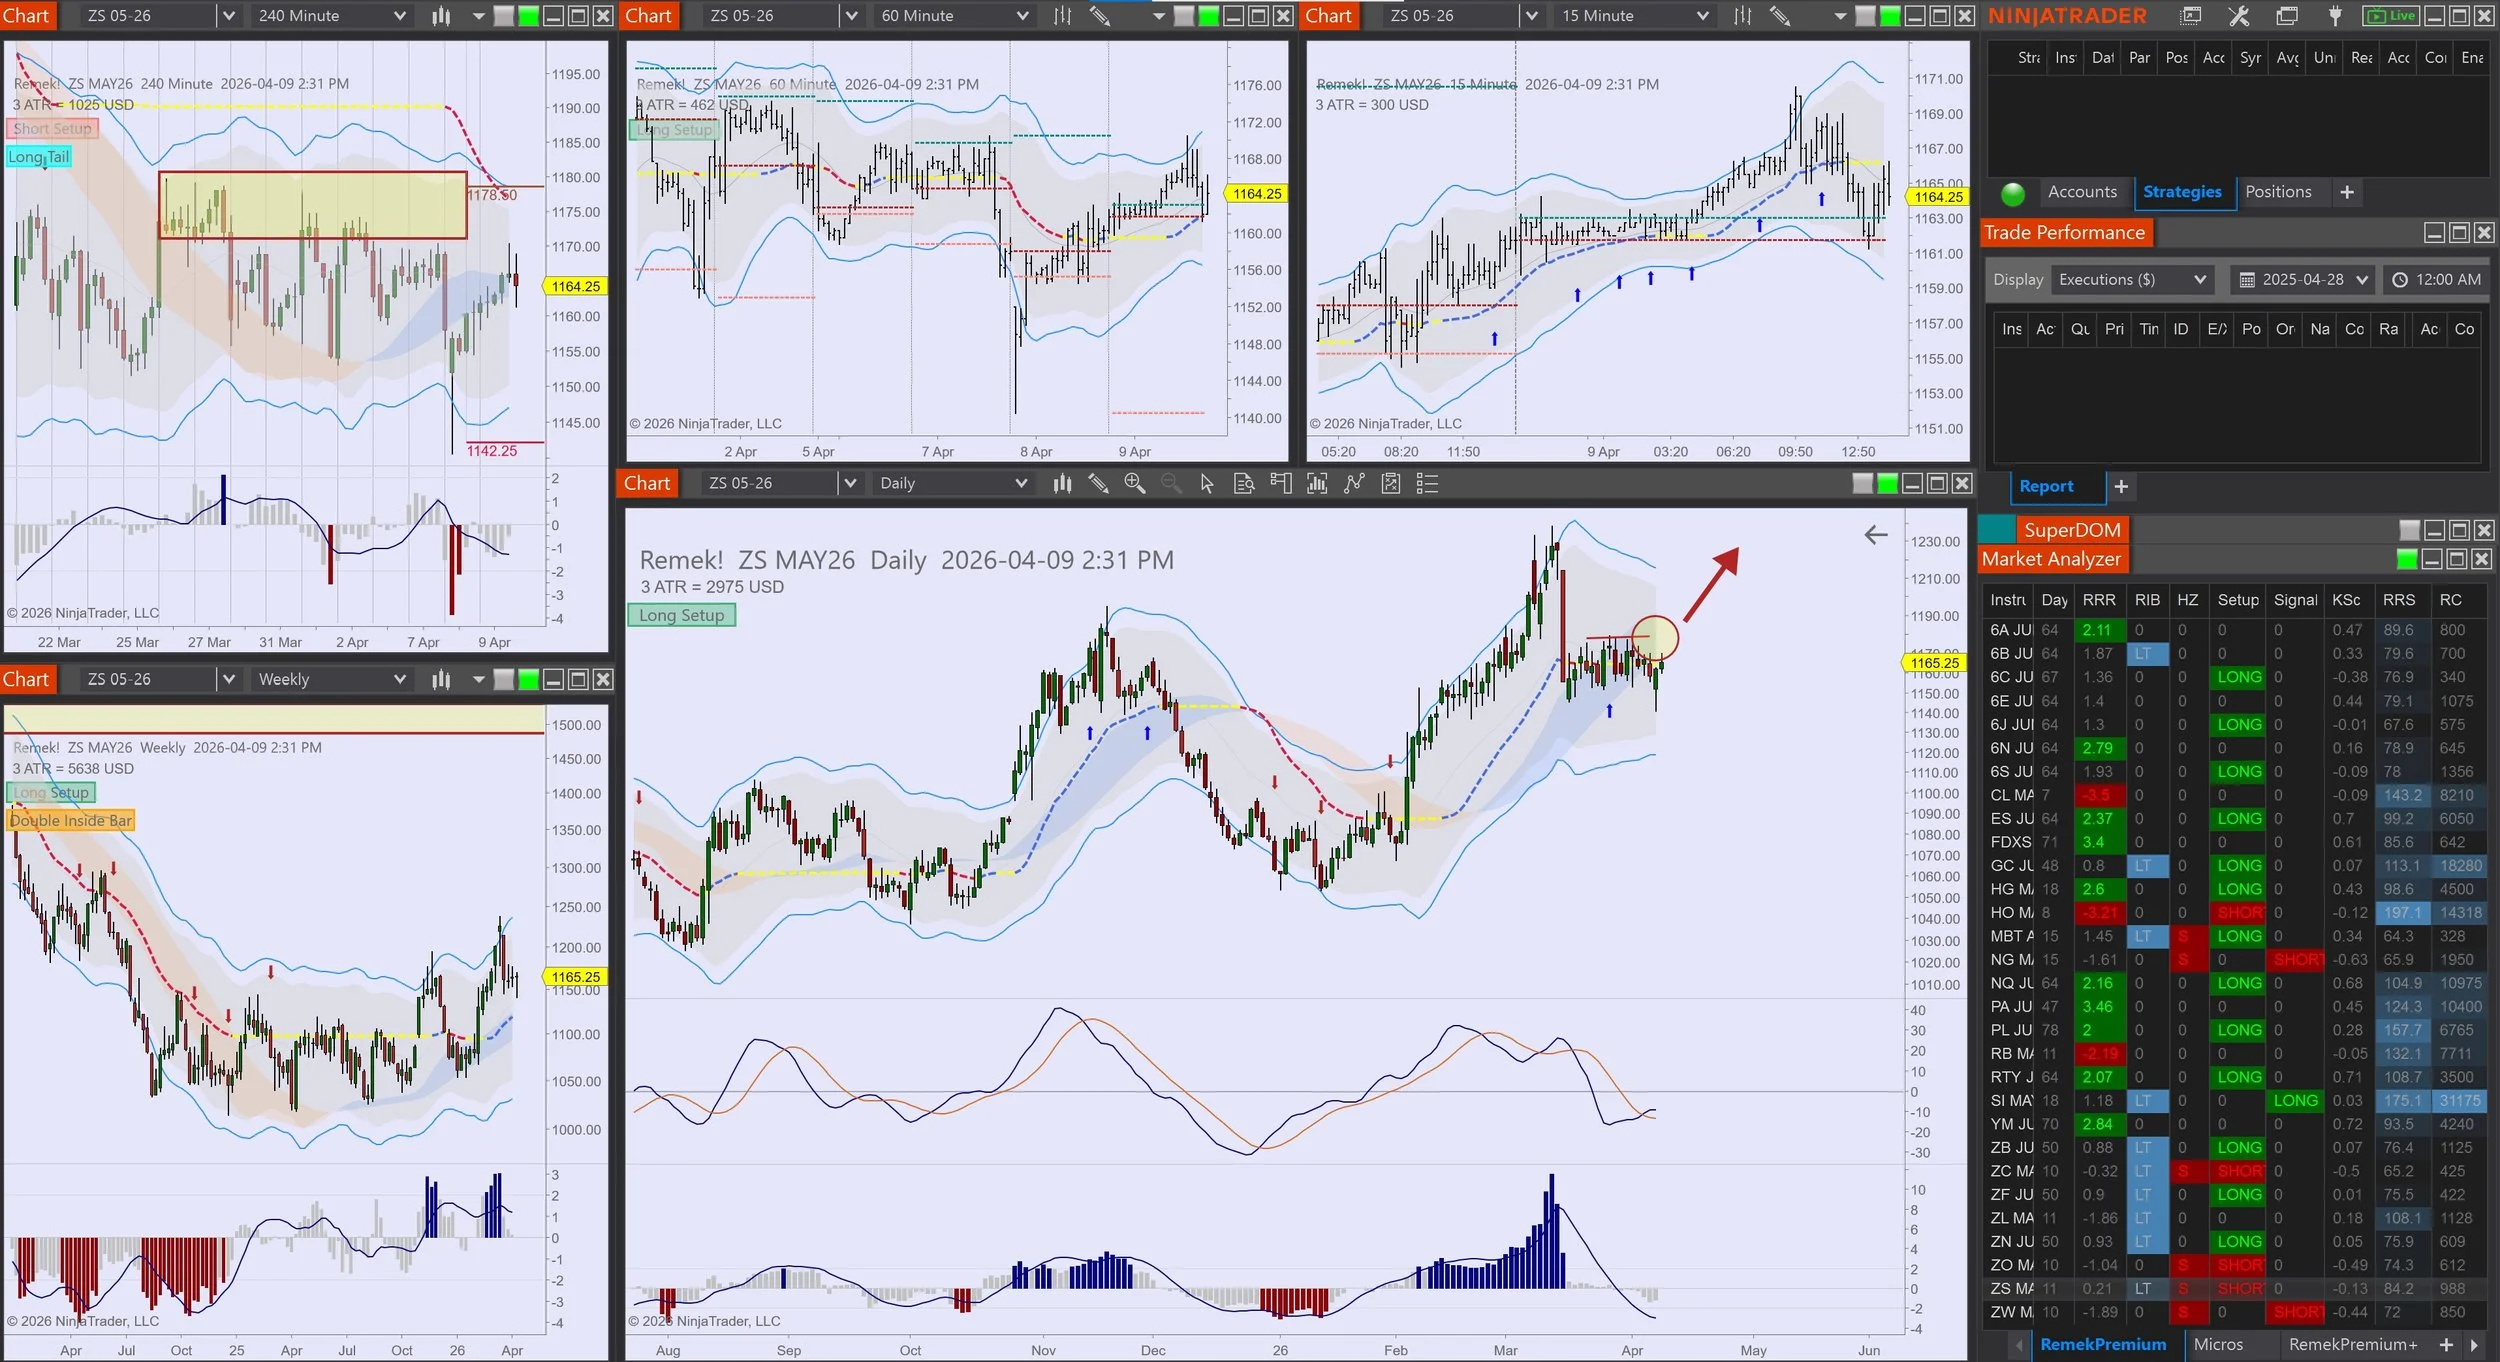
Remember our post on the 23rd? See the chart below with the higher timeframe taking control and the daily bearflag failing. Although not all timeframe conflicts get resolved this way, still: this is textbook. The question is, how do you translate this into trades?
Since a stronger DX means potential shorting opportunities on the cross-currencies (6E, 6B, 6S, etc.), let’s see what we find there:
Now, I’m writing this at 8.30am on Friday, see those emerging potential shorting opportunities on the currencies against the USD above in real time. (Note: we’re long on 6C, but Canada is a slightly different story, see resources, the likes of CL, GC etc.) Timeframe conflicts and their resolution, one way or the other, can provide important clues as to what may be coming next, and no, not in hindsight, but right now, in real time, going forward.
And if there’s one book you will want to read, once, twice and twenty times, so you’ll be on top of this next time, make it this one.
Mindful trading!