When running even the best designed backtesting and optimization tests, there is always a chance that our results are just by luck. There are a few ways to minimize that chance though and gather evidence that
“our test results from the past are, most likely, similar to what we would get in the future.”
While we can only scratch the surface of statistical testing in a post like this, consider some of those ways below, as you run your own tests:
Run the backtests with robust settings. Finetuning settings endlessly while running and re-running backtests is enticing, but leads nowhere.
Run the tests on various market environments (trending, range-bound), on various asset classes and instruments to see how the strategy holds up.
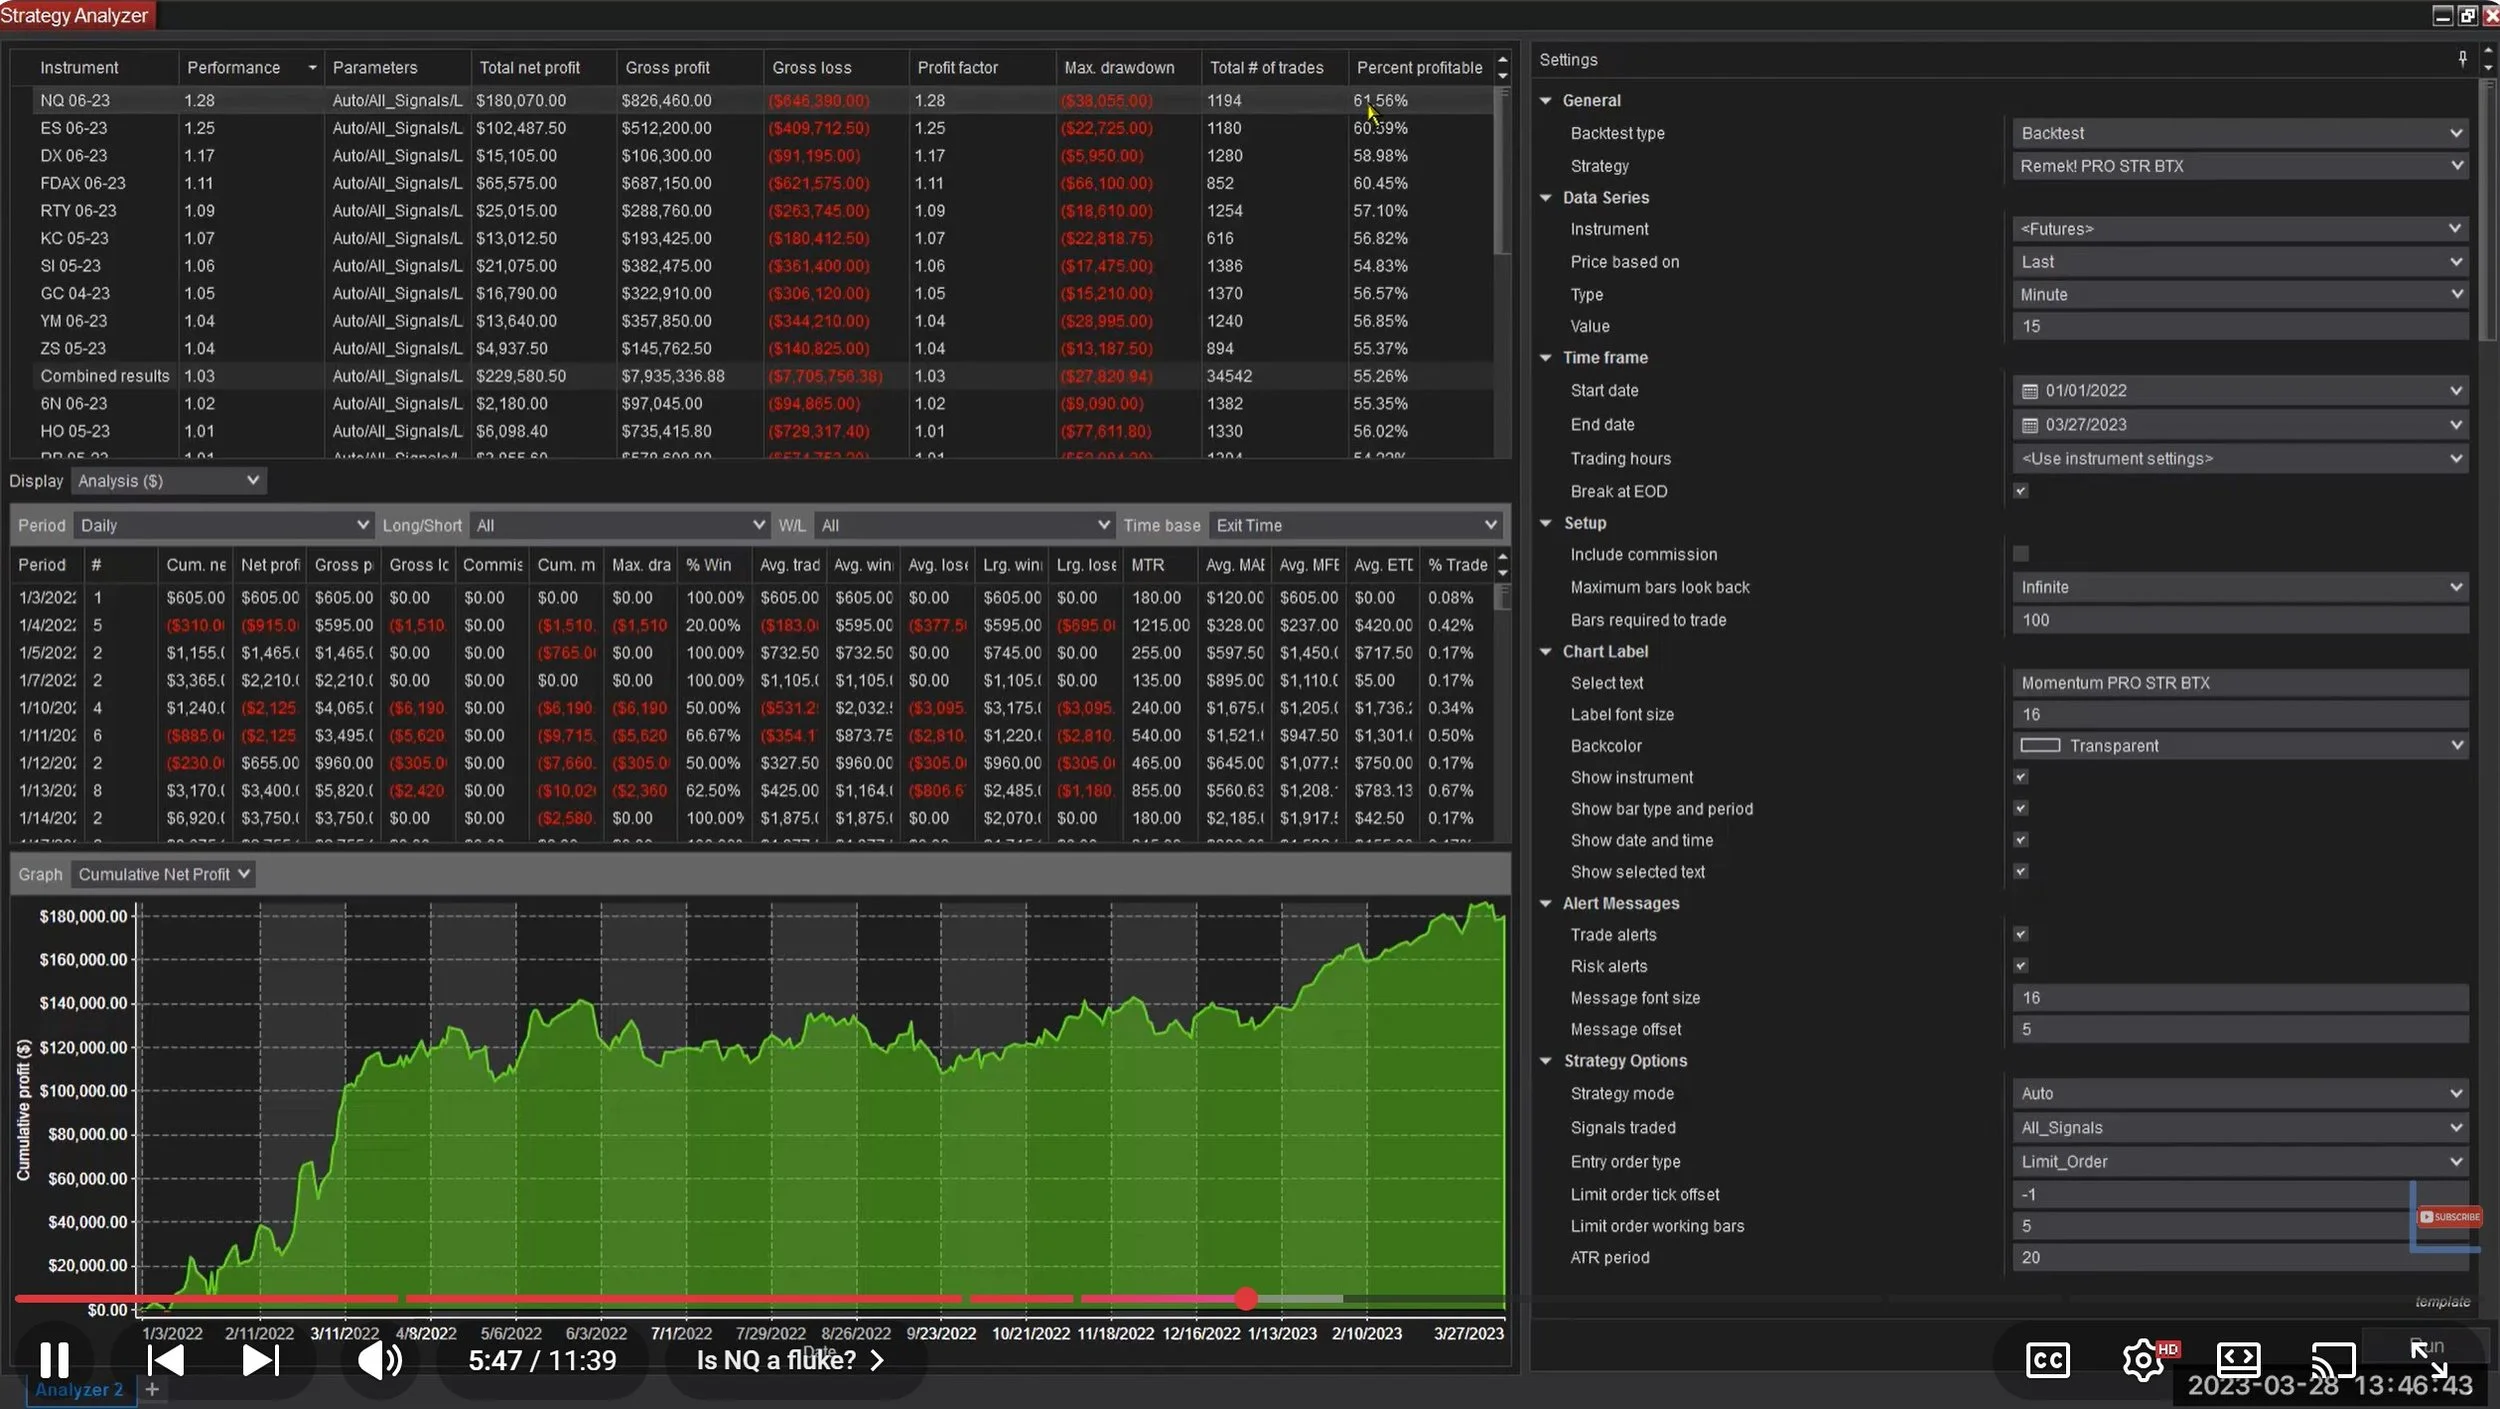
Make sure you have many events in your tests: statistical realities emerge over a large sample size. Think years and thousands of trades.
Always know your longest expected losing streak (every strategy has one), and plan your account size accordingly. In the life of every trader, the day will come when your account will be stress-tested.
Always be aware of the constraints of any backtests (your order was not really there, your order does not always get filled, your stop may not always protect you, futures contracts do expire, data from the past is a recreated version of reality, your internet connection is not 100% stable, computers can crash, hard drives may fail, you’re thousands of miles from the CME mainframes, and so on, and so on, and so on).
At the end, even with all the above precautions, and considerations, the results of a statistical test could still be just by luck. After all, nobody knows the future. You can minimize that chance of luck and build evidence that that is not the case by running Monte Carlo tests. Which is what we did, at the end of all our backtesting and optimization work in our quantitative work recently, in the video above. It shows that our equity curves are quite unlikely the result of luck. On the contrary: it is quite likely that our test results, those equity curves are the result of a statistical tendency. Which is the most we or anyone can say about a future that hasn’t happened yet.
It’s easy to see, our strategy stands tall in quantitative rigour. We hope you’ll have a serious look at our Remek! Momentum Pro Standalones, but whatever method or strategy you decide to trade with, passing such tests with such flying colours is the minimum you should demand, before you even risk a single dollar of yours on the markets.


So let’s re-visit our video series, including our forward-testing “month in an hour” series, all the backtests, the reserved optimizations, and those Monte Carlo tests. Numbers do not lie, and verifying and re-creating our tests is easy. You’ll find what we have found: The Remek! Momentum Pro Standalones captures and exploits crowd behaviour efficiently.
A 30-day FREE TRIAL as well as myth-free training and education and an extensive library of resources, not to mention our rock-solid Forum are all available to you to help you be the best trader you can. With 2024 just starting, and with the NQ at 52-week highs, we see no reason to delay.