The story of a(nother) 1R

The trade below encapsulates how we see and trade the markets, so we thought we’d share it for everyone’s benefit. The series of events similar to those seen below happen way more often than to be dismissed as random. This is, in fact, what a certain aspect of crowd behaviour, i.e. the re-emergence of momentum out of consolidation areas, looks like on our charts, and this aspect of crowd behaviour can form the basis of a successful trading methodology. Get the tools and join us as we track the markets!

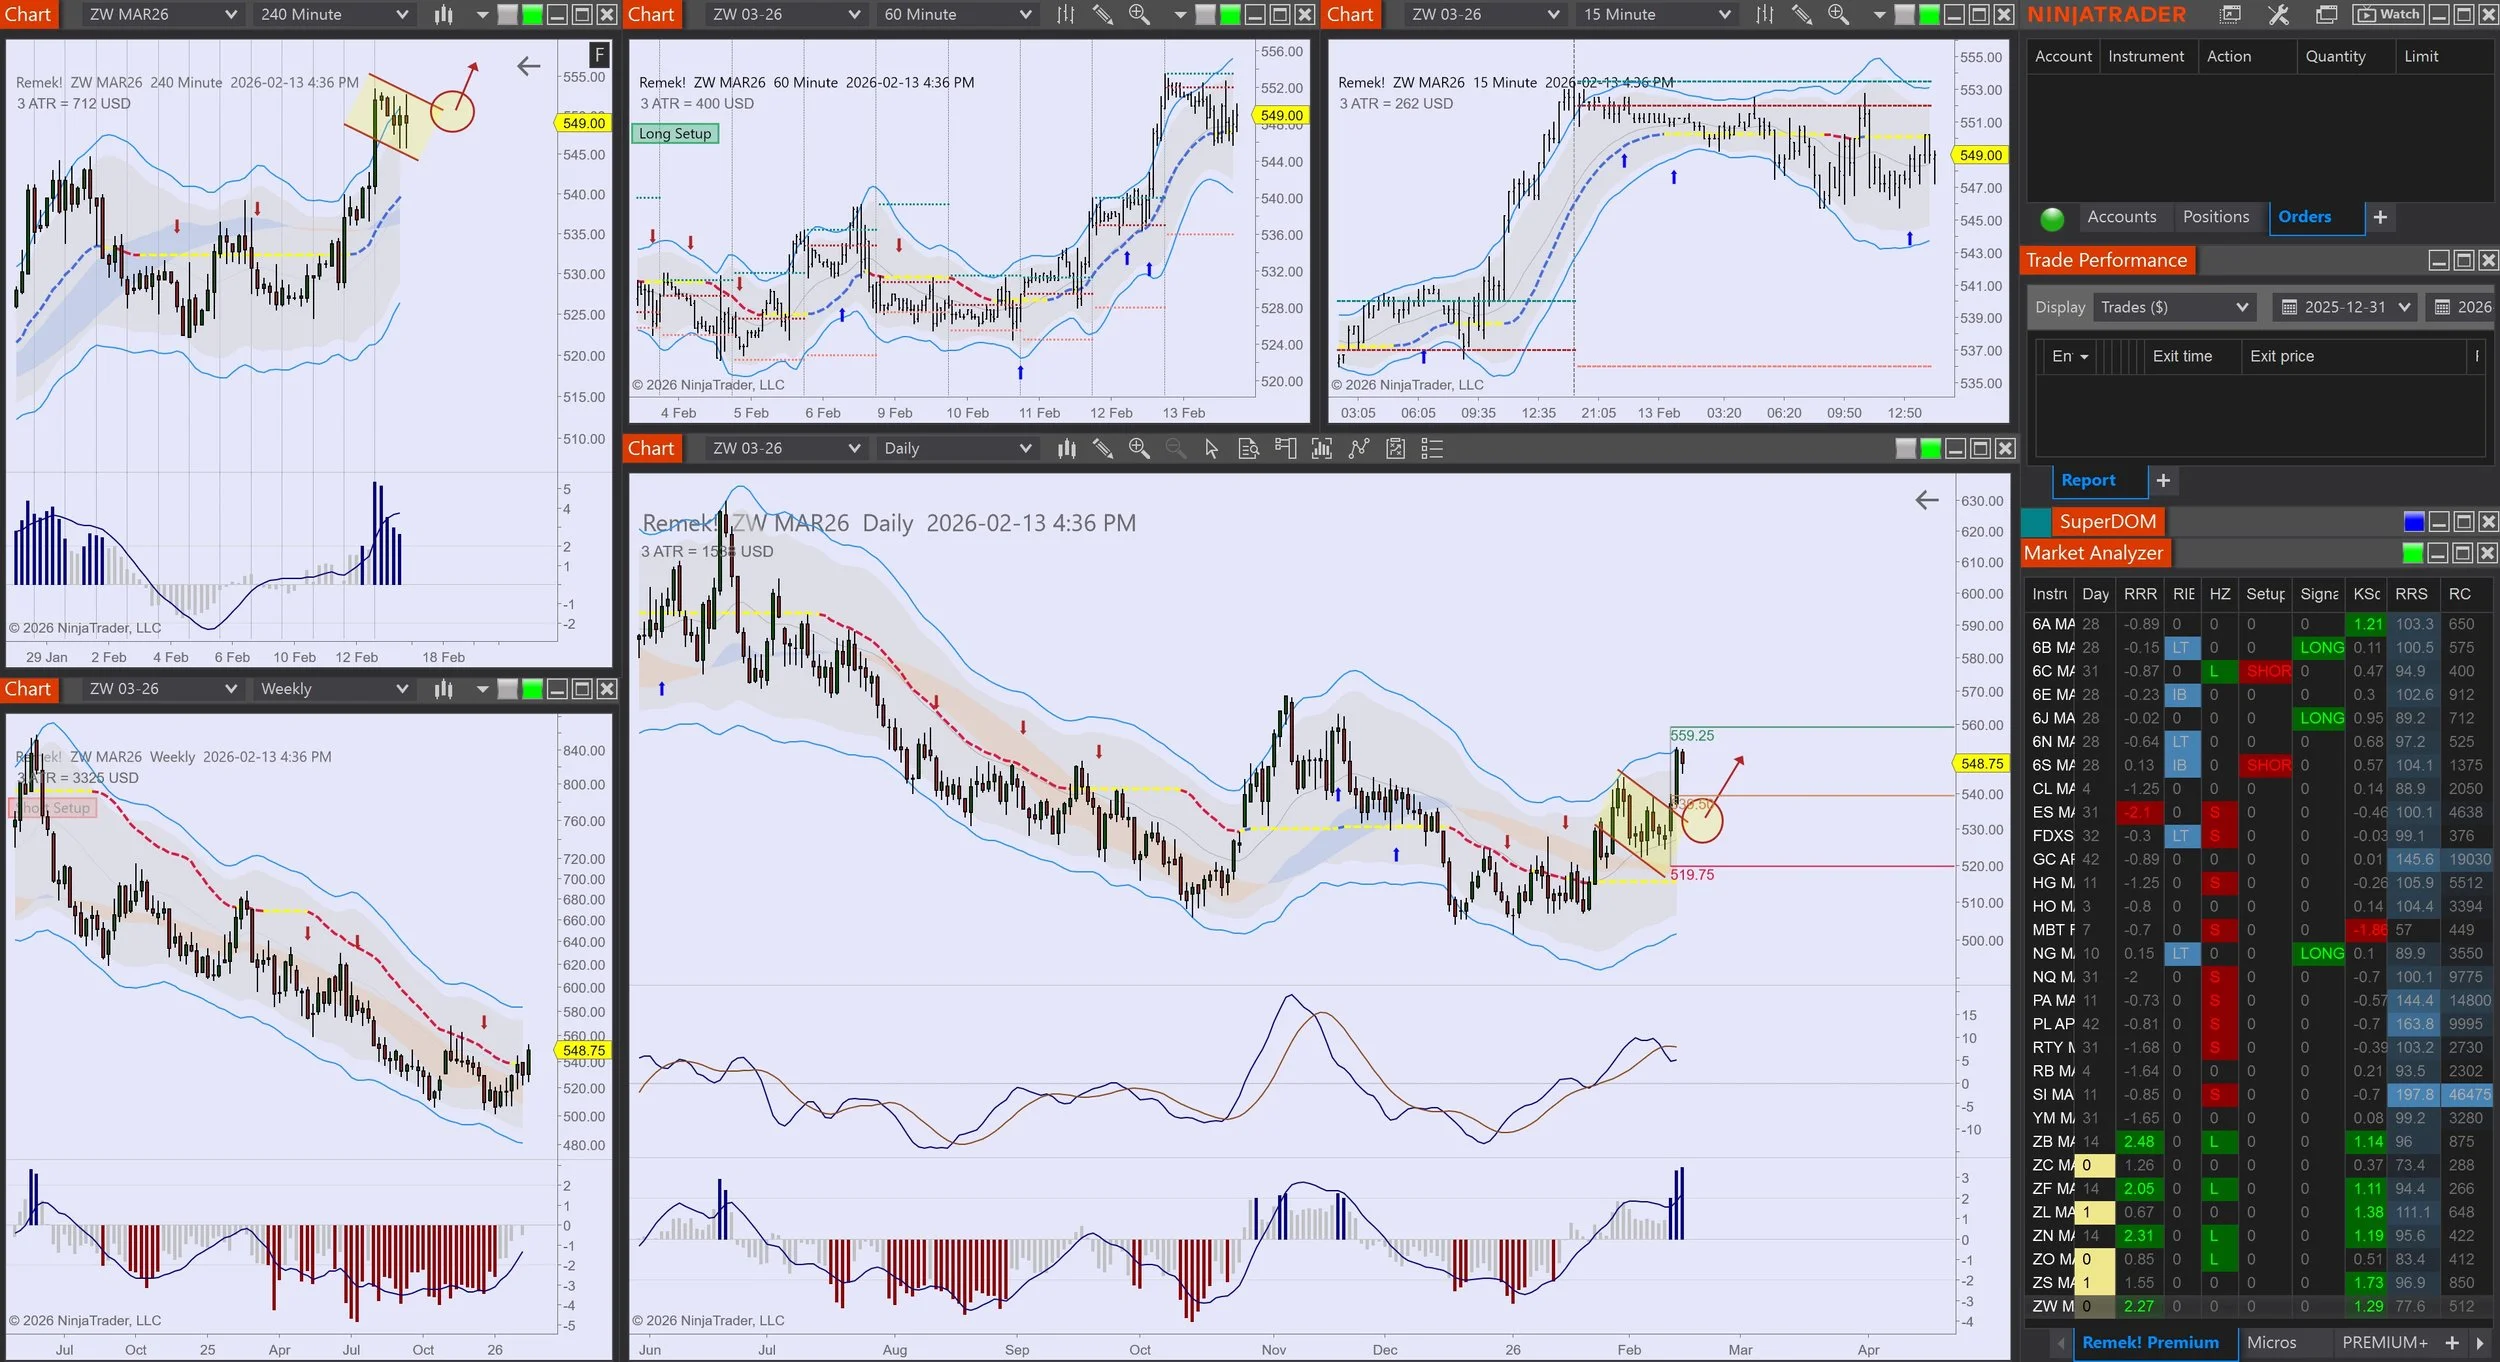
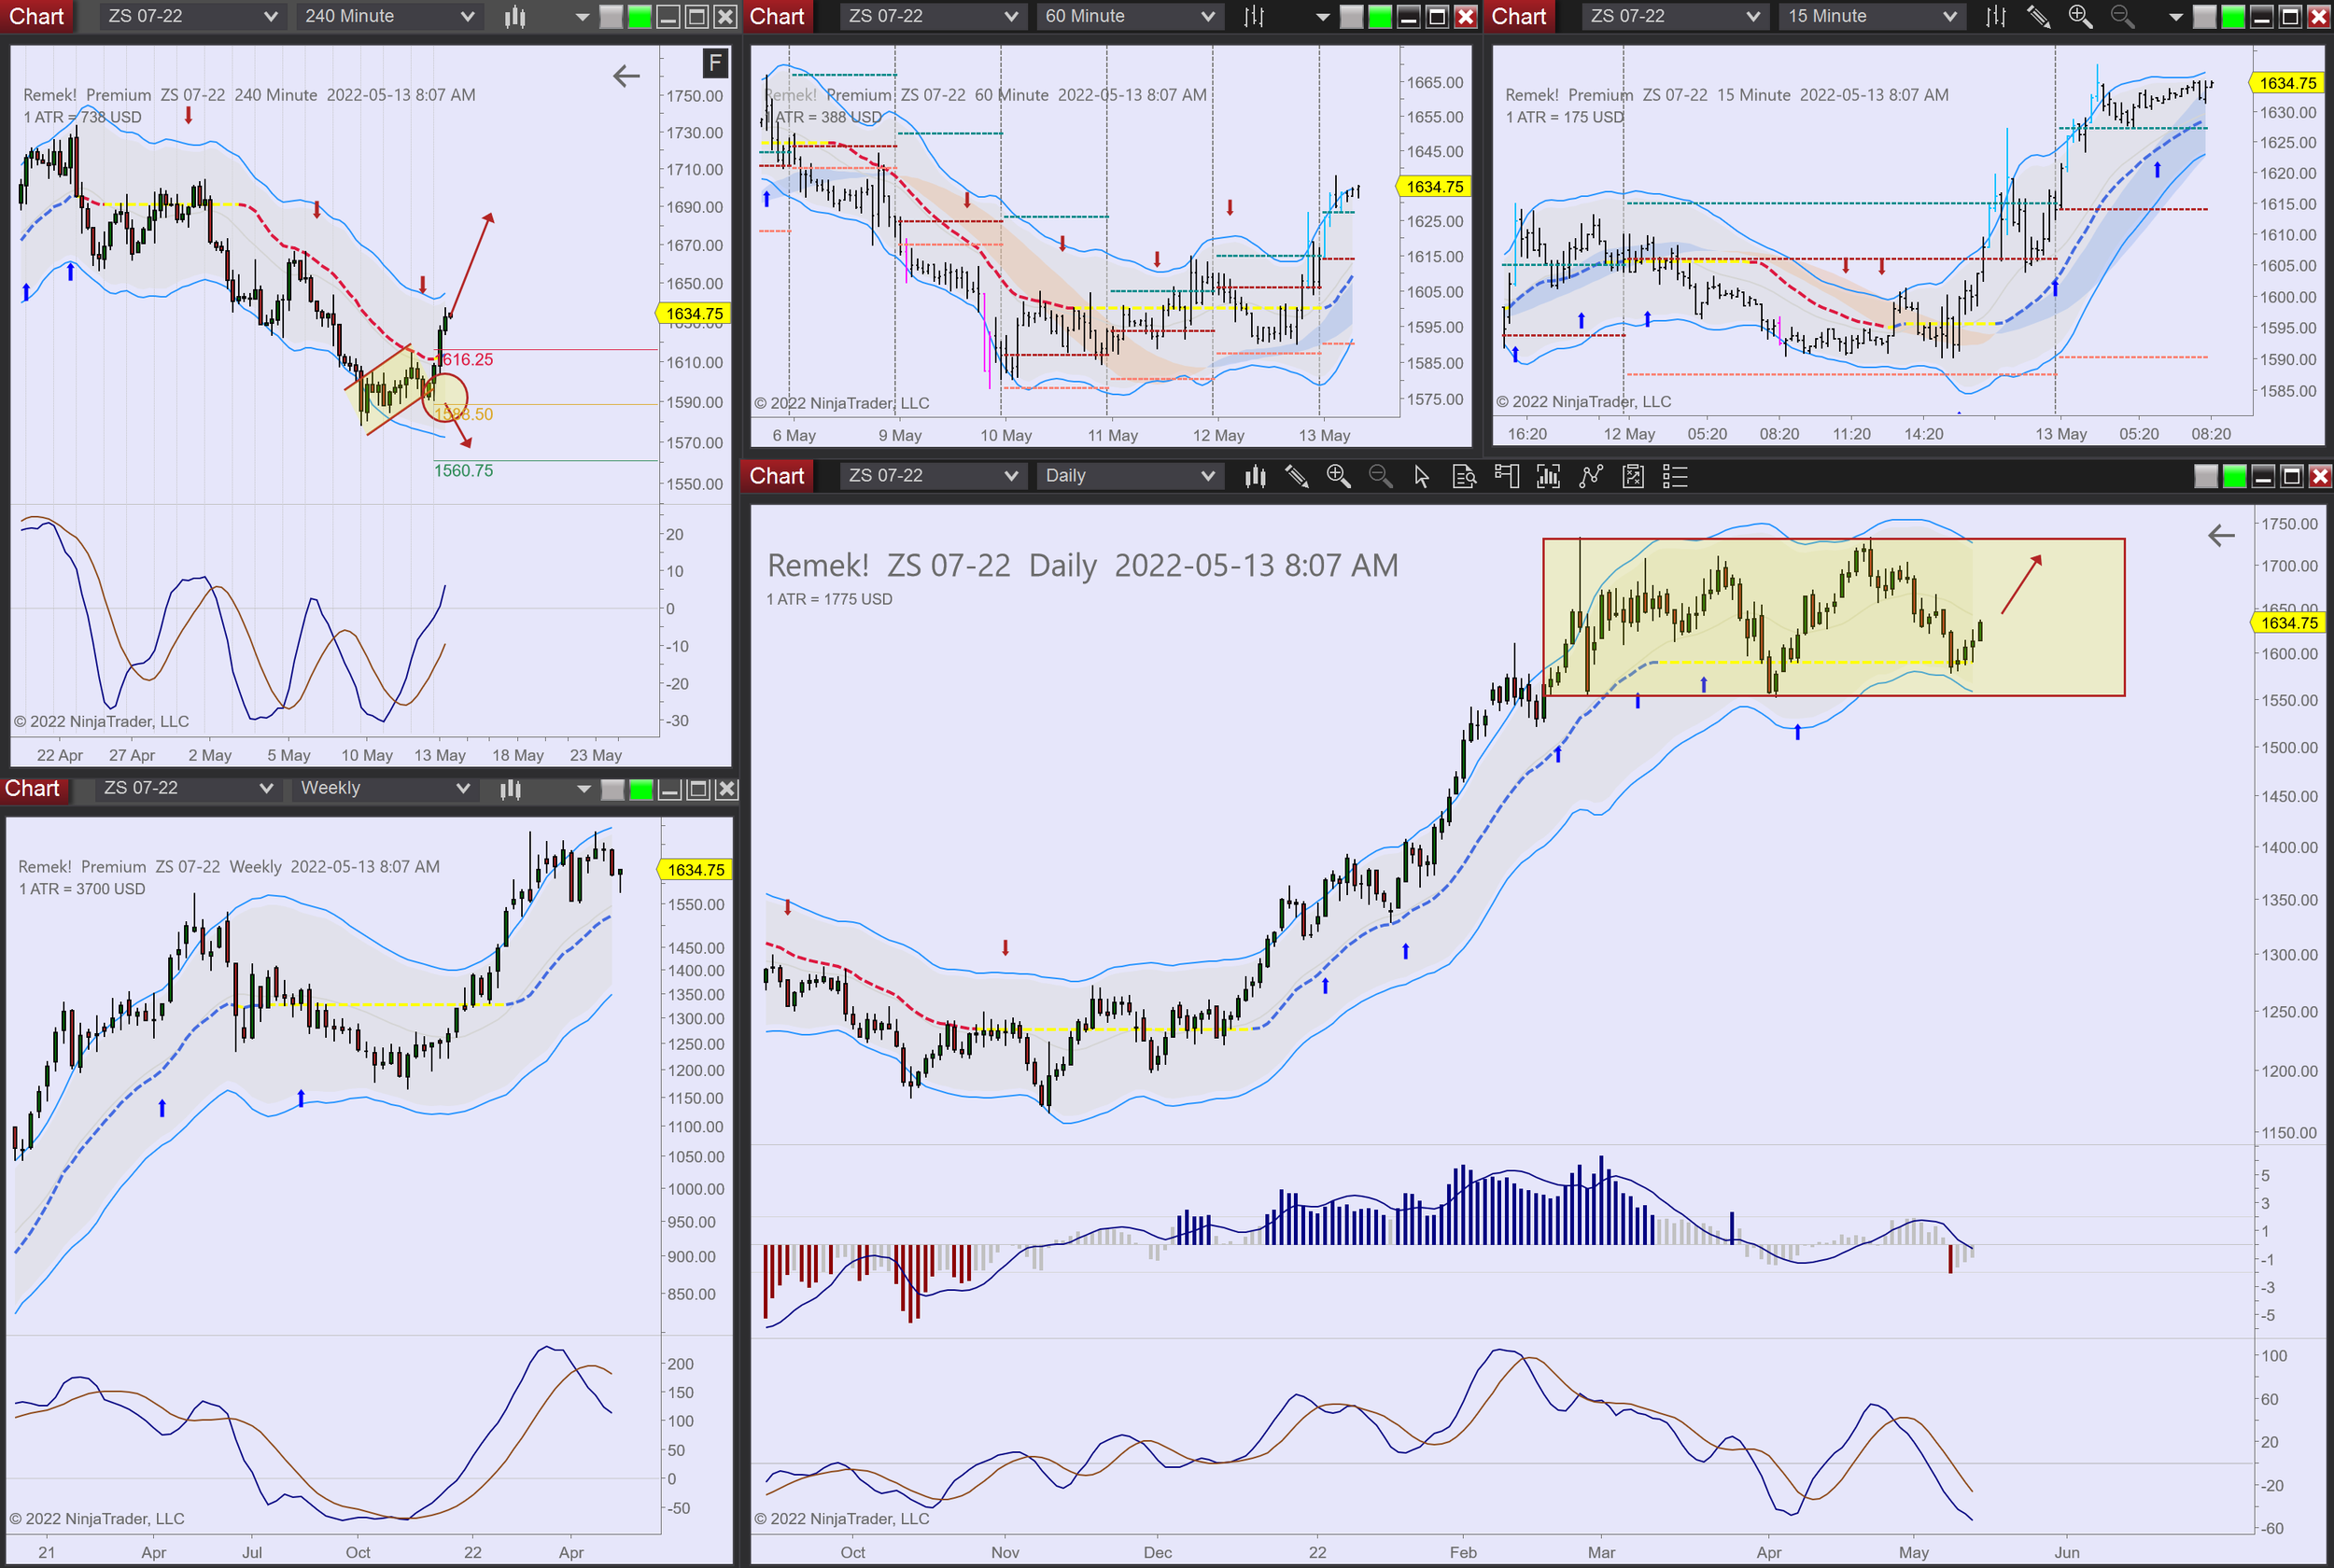
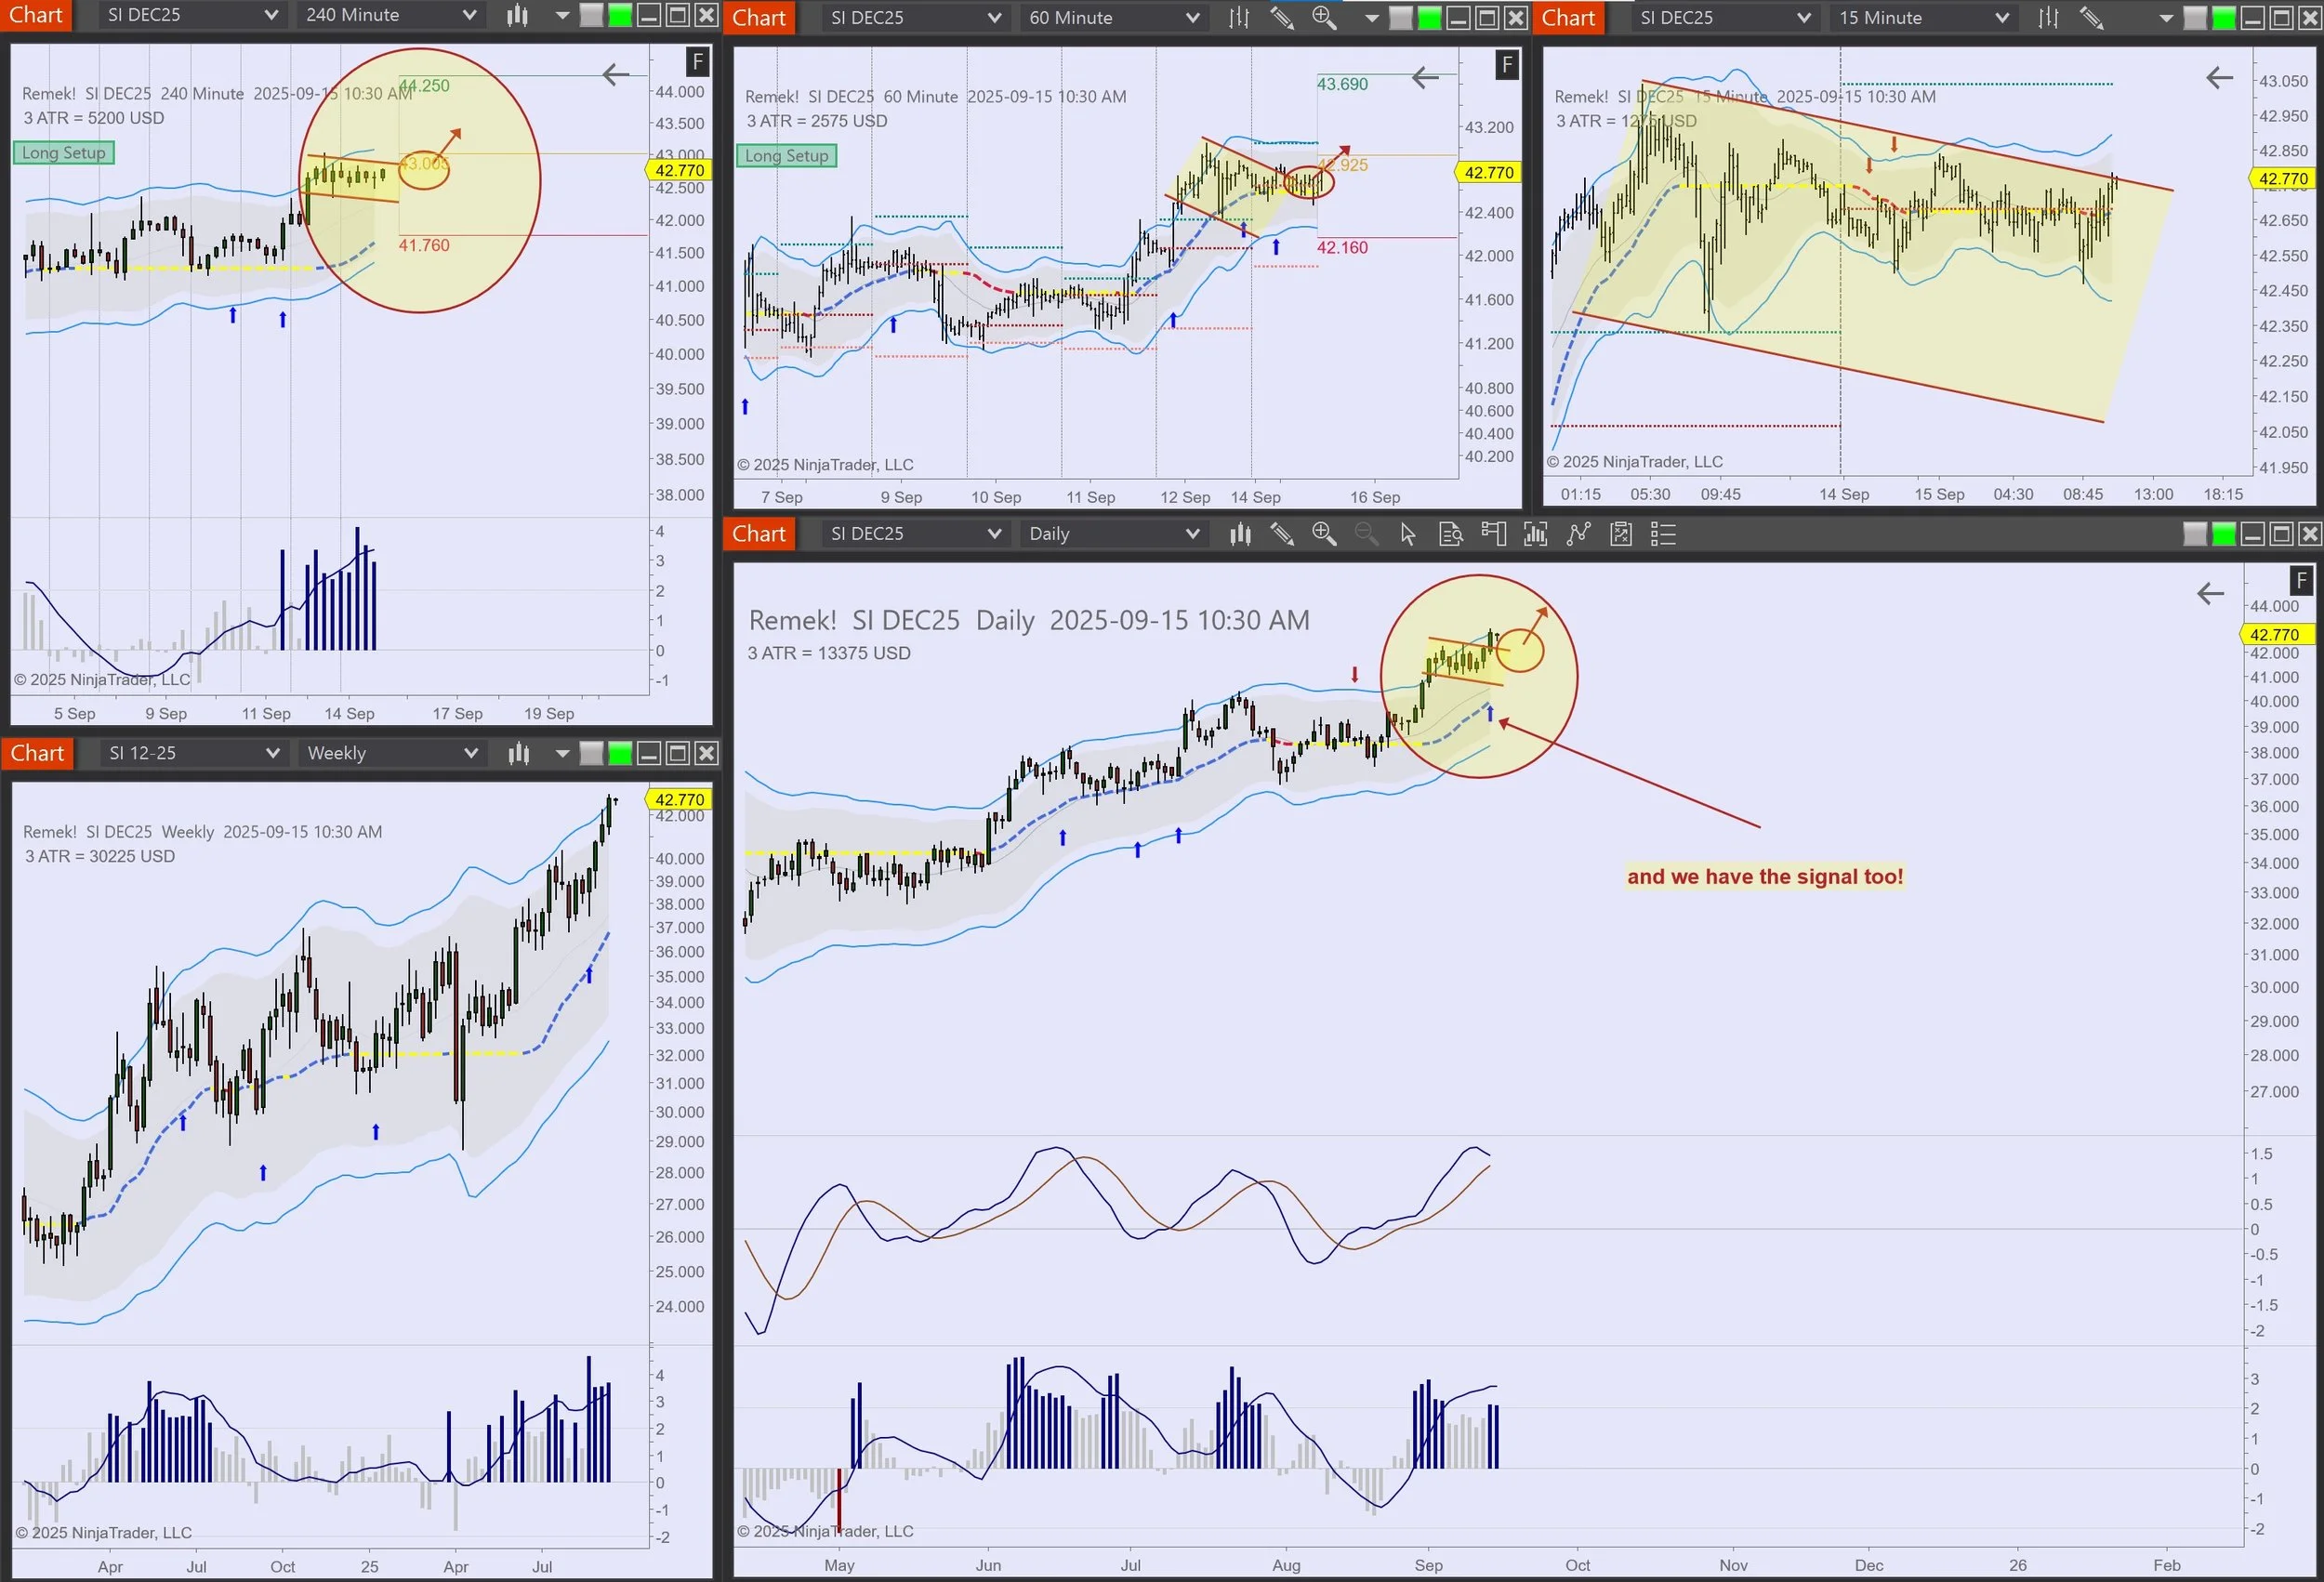
March 27, 12.27pm: we identify the opportunity, a complex consolidation, and the expected re-emergence of momentum (and share it with our Premium membership at the time, as well as in a public post at the end of the day)

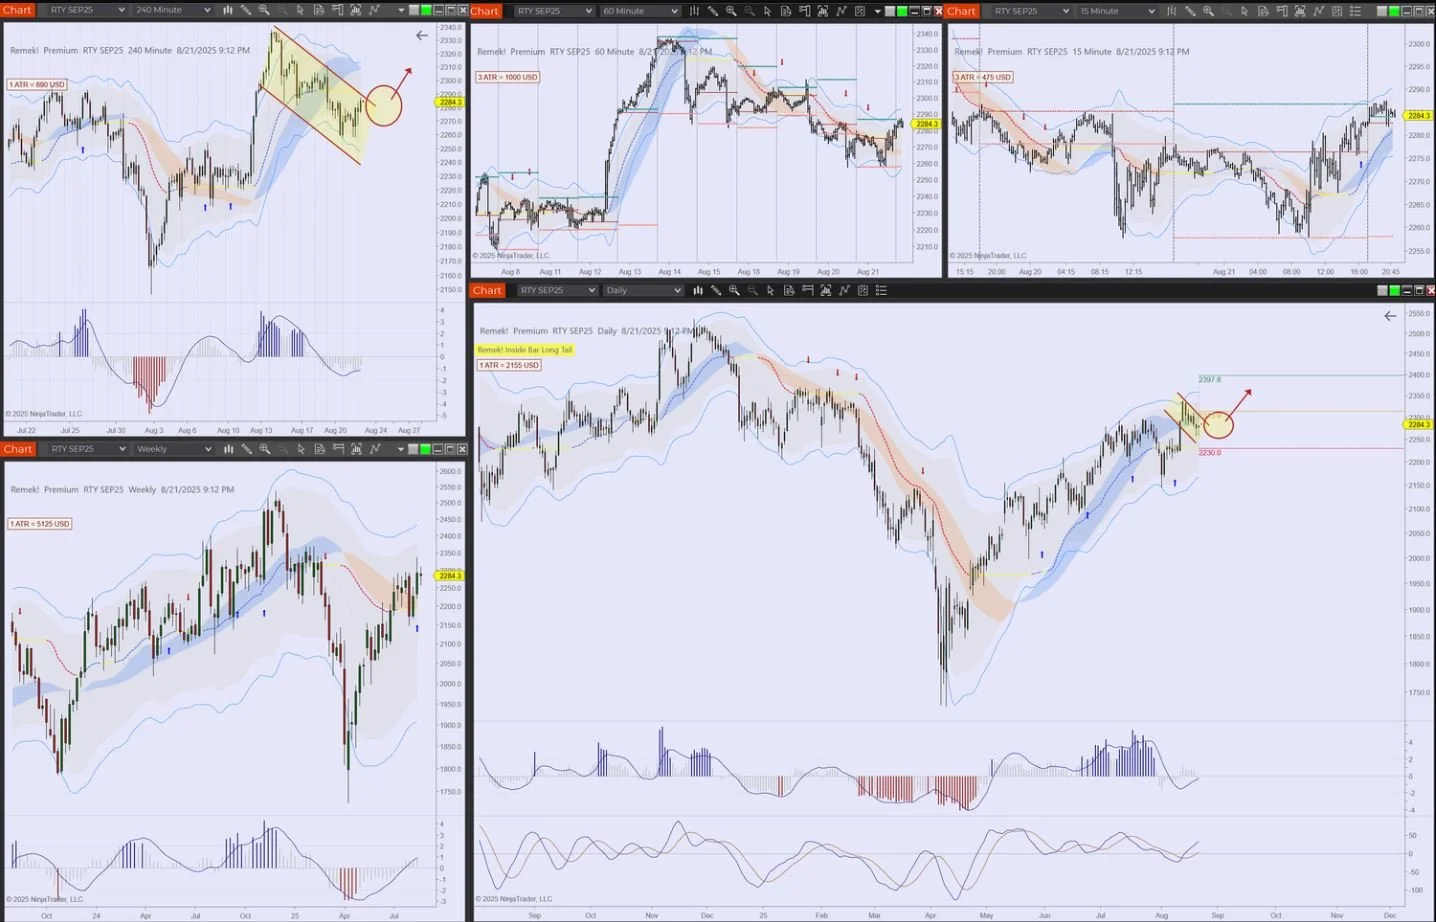
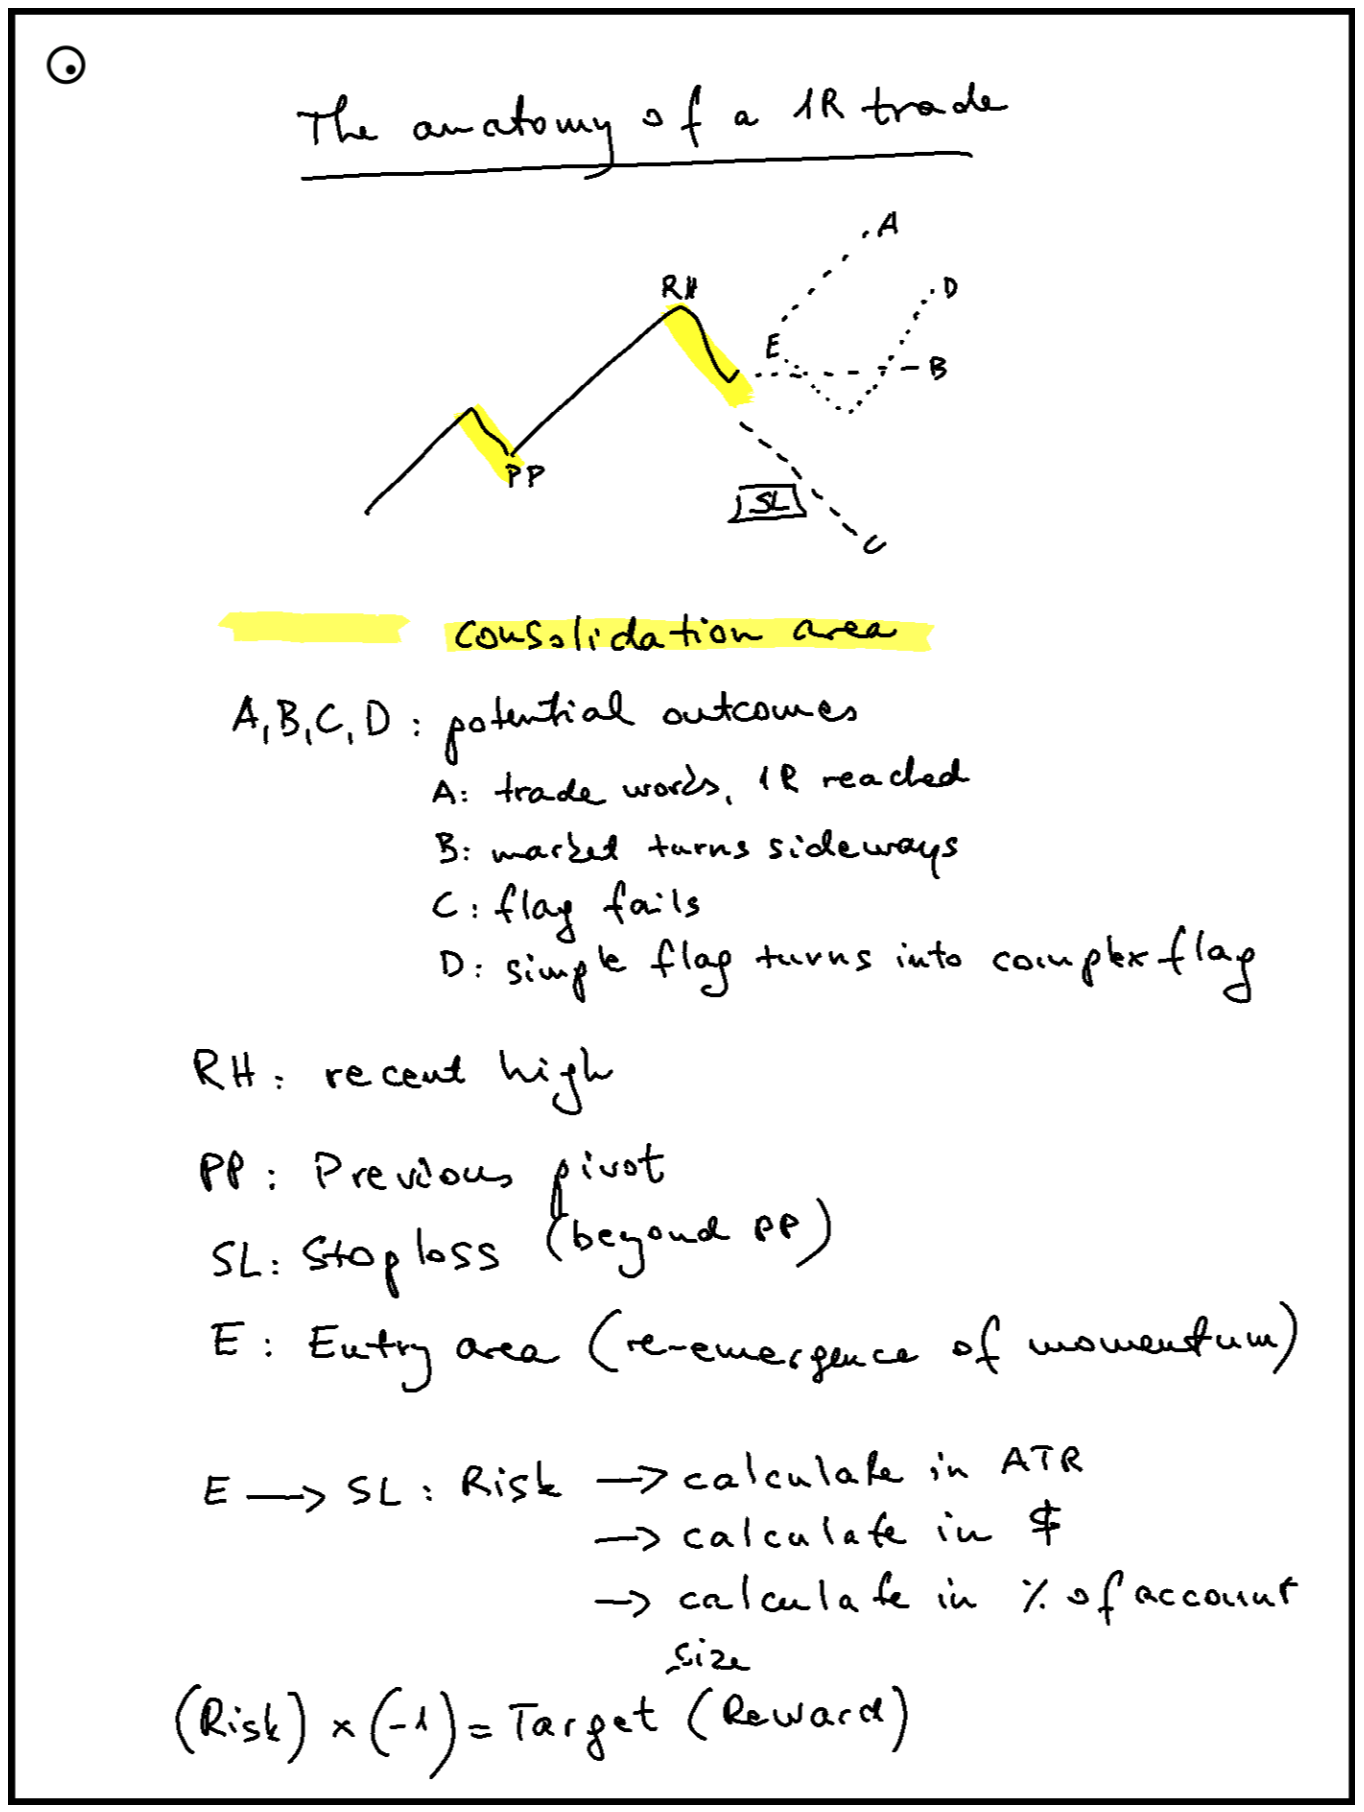
A few hours later momentum re-emerges, we get triggered into the trade. We use PRO STR for the job, but the job can be done with BT as well, and can be split to smaller trades on lower timeframes. Notice our resting stop entry at the top of the red candle two candles back.

The trade is completed at 1R.

Distance in dollars?

Everybody knows how many dollars is one point or one tick. And since it’s obvious and easy, we tend to think in the rigid terms seen on the right. But that is misleading and can be counter-productive in more ways than one. One being that among the four indexes, the NQ is by far the riskiest to trade, a fact so easily hidden by the tick=dollar equation. (Note: the column “USD” in our excel-like Market Scanner Pro to the right exposes the real relative risk involved.)

So what counts, really, is how many dollars is the distance between our entry and our stop. And since we measure our risk in ATRs, usually around 2.5 ATRs, the question becomes:

How many dollars is 2.5ATRs? Any time, any instrument, any timeframe!

Now that is a little tougher to answer…

From here, we can do two things: grab a pen and paper, or Excel and jump into elaborate mathematics. It’s possible, just not very practical, surely not in the middle of a trading session (especially because you’d have to re-run the math on the close of each new candle… gee!). But all that is necessary, not since we’ve had Remek! Converter! It does the job in milliseconds, any time, any instrument, any timeframe. And since the dollar equivalent of 2.5 ATRs is not a written-in-stone number, as it will change as volatility changes, Remek! Converter will always give us the current value of this crucial metric.

Now, Remek! Converter represents advanced tech, and we do encourage you to get your copy. In fact, the concept is so useful that we have also built it into our most advanced trading engine: PRO STR BT. PRO STR BT bases its algorithmic decisions on the current (real-time) volatility conditions of the market as it manages your trades.

Want to see it in action?

Remek! Converter + PRO STR BT = professional, volatility-adjusting trading. To quote a classic: Don’t leave home without them!

Want to know more about PRO STR BT? Check out our BT Design Components Series. And sign up for a free trial today!