
“Gold shruggs off an anti. A turning point?”, we wrote last September in our analysis of the weekly GC chart. Evidence-based technical analysts will know: the failure of a weekly pattern is an event that deserves attention, the market itself being the only leading indicator.
Bullflags on weekly charts can take weeks and months to develop, and, as Remek! Premium subscribers can tell, we were not totally inactive on precious metals in the latter part of 2019. (See another example here.)
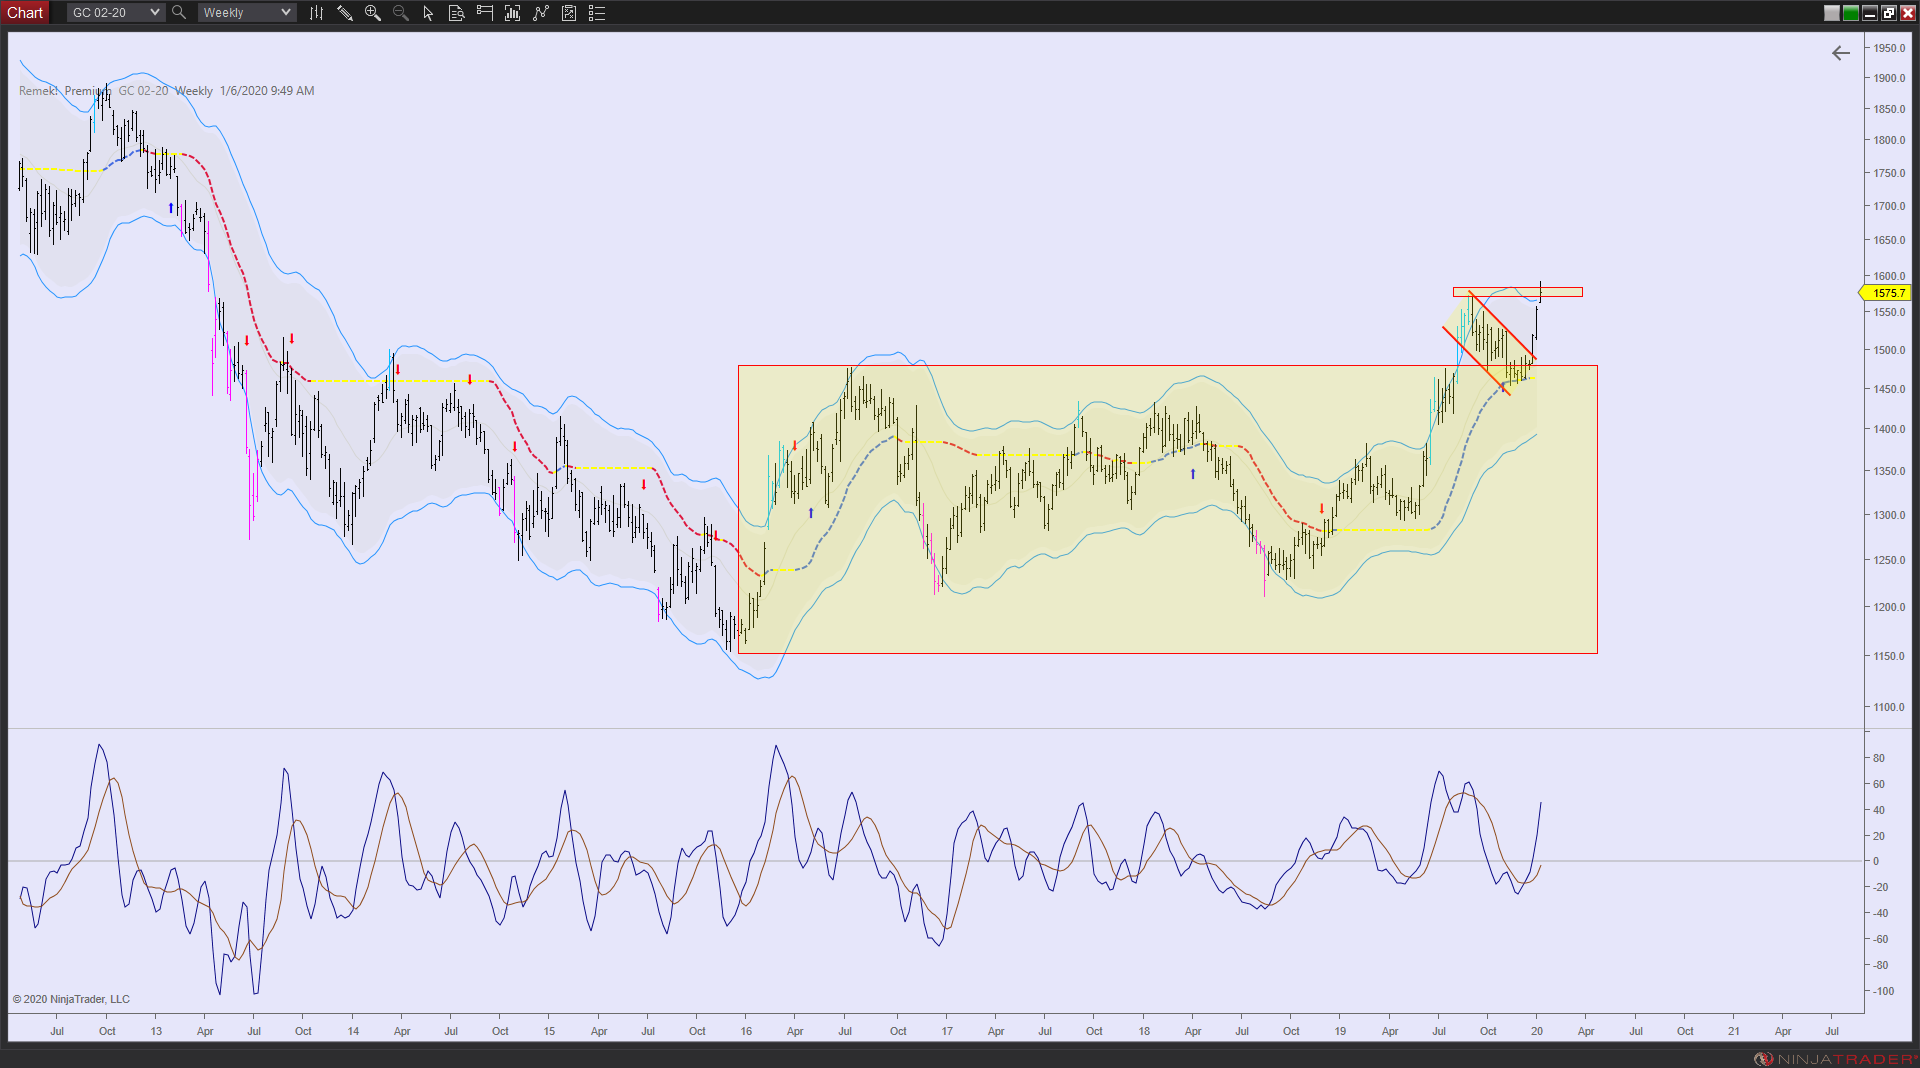
Today you switch on the radio and the world is talking about gold as if today’s chart were a surprise. (2011 anyone?) For evidence-based technical analysts, however, the structure has been clear for months, the real task has been to trade it within a given risk management framework.
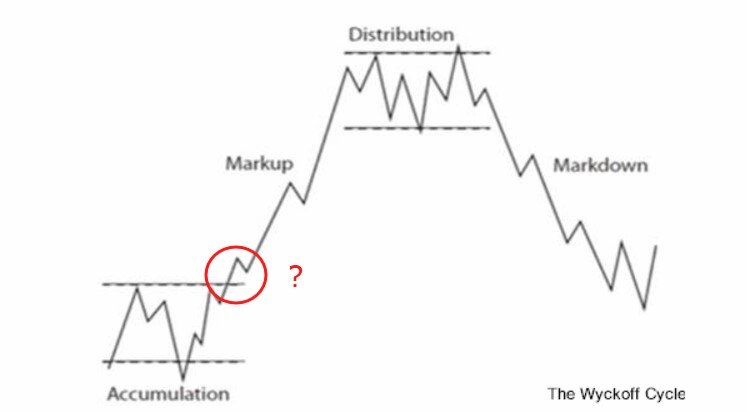
Lastly, you may also want to ponder the two images on the right: a weekly gold chart and the idealized Wyckoff cycle. Time will tell if our hunch is a good one.
Check out Remek! Premium today, the first 15 days are on us!