

REMEK! Momentum Pro standalones - Documentation
Part 5 The setups
But first, about timeframes: To make the most of what Remek! Momentum Pro Standalones offer, it is important to select and constantly review the timeframe traded (see this post for more), and whether our account is suited to trade that given timeframe. See the chart on the left: if you see too many short, insignificant runs and instant reversals, you’re probably on a timeframe that is too small (aka too noisy)
on the given instrument
at the given time and
in the given market environment.
Consider this: the proper timeframe is also a function of the given market’s volatility. And that volatility will change, not only across instruments, but also over time. As an example, in the fall of 2019, the average daily ATR on the ES was about 15 points. This means the ES in those days moved about 15 points every day. In the spring of 2020 that value was 150, a ten-fold increase. In March 2020, on average, the ES moved about 150 points a day. Think of a drunken monkey jumping on a trampoline! The account size that was - mathematically calculated - sufficient to trade the ES in the fall of 2019 would have been insufficient in March 2020, simply because the size of the required stops, as measured in ATR, increased tenfold! So many traders who happily traded the ES in the “15-point daily ATR” days found that their account is simply not enough to trade the same instrument in the “in “150-point daily ATR” environment of March 2020! (Those who didn’t keep up with the changes and didn’t do the math, surely learned some lessons the hard way.)
With the above said, and with our trading timeframe properly defined, we will proceed with trading our methodology.
The Remek! Momentum Pro Standalones are all about trading the re-emergence of momentum (aka pullbacks or consolidations) successfully. The key word is successfully: although every trader is familiar with the concept of pullbacks, few are able to trade it reliably and consistently. The Remek! Momentum Pro Standalones have been specifically designed to help traders to master the art of trading moves out of consolidation areas.
And before you think “what’s the big deal about pullbacks”, let us repeat: although all traders know or have heard of this setup, few traders, in general, make money on the markets, so obviously few traders trade pullbacks successfully. We want to show you that successful trading is achievable by learning to trade this setup correctly.
The Pullback trade
First things first: there are two types of pullbacks:
- simple and
- complex.
A major difficulty of trading pullback trades: when you enter the trade you do not know yet if the pullback remains a simple or evolves into a complex pullback (or fails altogether). A critical element of trading pullbacks successfully is being able to manage the trade regardless of whether it turns out to be a simple or complex pullback, or if it fails. Since every complex pullback starts out as a simple pullback, and the transformation often occurs in front of our eyes (see below), a plan must be in place prior to entering the trade. Not being aware of these requirements is probably the major reason why most traders do not trade pullbacks successfully. You do NOT have to belong in that group any longer!


All Editions of Remek Momentum identify these setups reliably, in real time, so you can plan the trade. Remek! Momentum Pro and PRO STR also give you a heads-up in advance as the trade is setting up (even across a large number of instruments, thanks to Remek! Market Scanner Pro).
Advantages of trading pullbacks:
pullbacks are manifestations of a fundamental characteristic of markets (which is: alternation between momentum and mean reversion),
pullback trades, when done right, offer a good opportunity to design our positive edge.
Disadvantages of trading pullbacks:
sloping entry area makes defining stops difficult (we make this a little easier by measuring risk in ATRs, i.e. based on the market’s volatility at any given time)
any pullback setup may turn into a complex pullback, making trade management challenging and requiring a potential re-entry if stopped out.
a subset of pullback setups will trigger but then fail. Since a subset of any setup exhibits this behaviour, this is not specific to pullbacks, but something we, as traders, must be aware of.
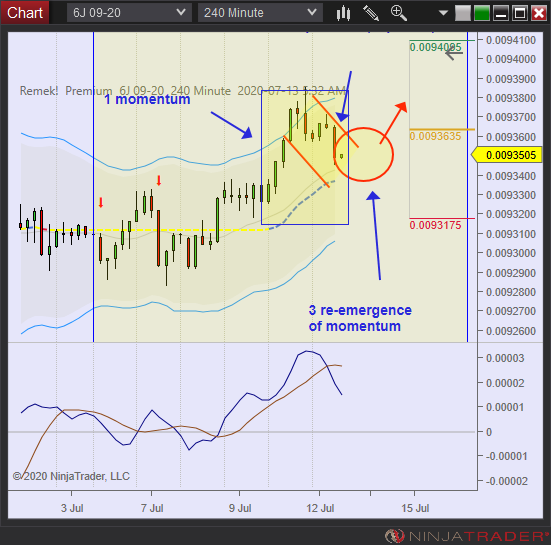
OUR SETUP AND TRIGGER
The chart above demonstrates what we’re looking for in the markets:
Initial momentum
Pullback (aka consolidation) towards the middle of the Keltner Channel
Re-emergence of momentum
1 and 2 represent our “setup”. Nr. 3, the re-emergence of momentum is our “trigger”, the last piece of the puzzle required to enter a trade. The stop (in red), the entry (orange) and the target (green) shows our 1R trade management framework (1R: reward = risk).
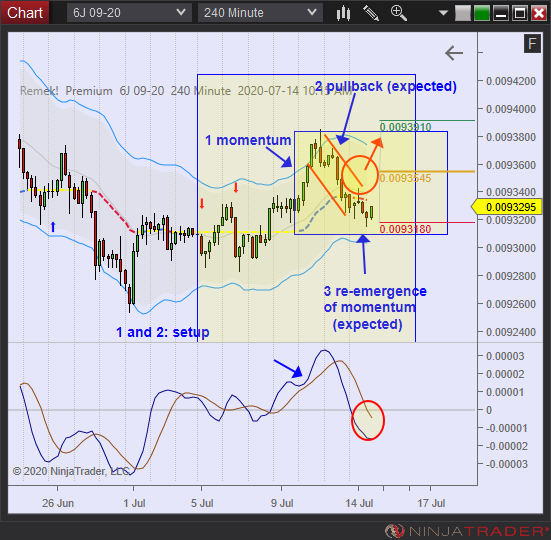
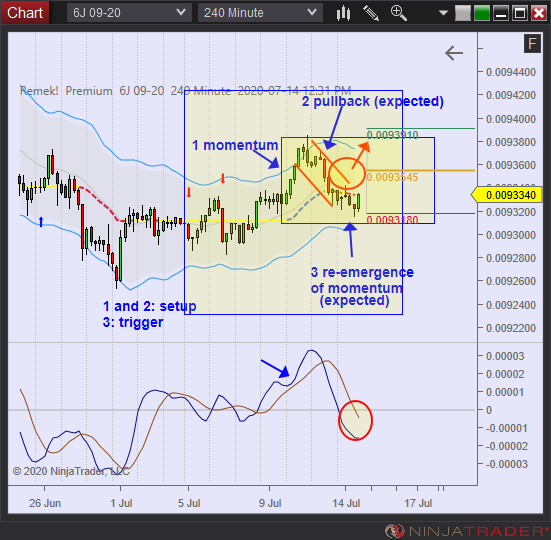
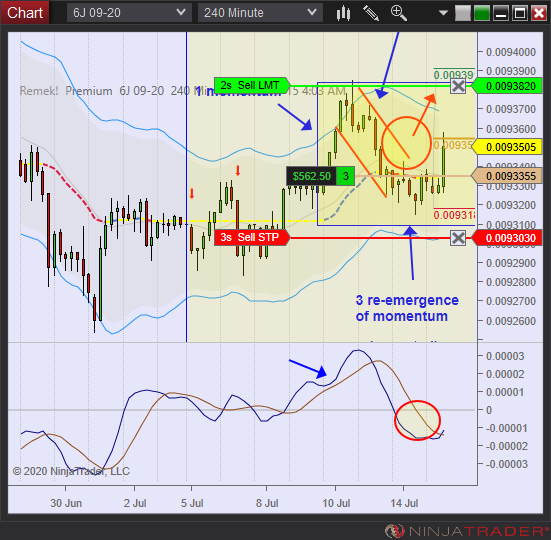
The chart to the right shows how pullback trades emerge in real time, and how we can anticipate them (see charts for timestamps).
Using Remek! Market Scanner Pro to identify opportunities
Let’s see an example of how to use Remek! Market Scanner Pro (part of PRO STR and BT/X) to identify setups and trading opportunities ahead of time:
1 Sorting instruments in the Remek! Market Scanner PRO
Sorting by the RRR (Remek! Relative Return, aka “triple R”, ) column will show you the instruments that have made a substantial move (either the day before, or on the current day, depending on your column setting “Update On: Bar Close or Price Change”). Instruments thus identified tend to offer good trading opportunities going forward.
2 Sorting by the setup column
Sorting by the Setup column will show you which instruments are currently setting up, meaning only one condition is missing from all the required conditions to take the trade. By connecting Market Scanner Pro to the chart with the Instrument Link, you can click on the instrument’s row to switch to the relevant charts.
3 Considering the identified trading opportunity
You can also see what instruments currently triggered a trading signal. An optional sound alarm, email alarm can also be attached to the signals in all three columns.
Note: Consider Remek! Relative Strength, Remek! Converter and Remek! Inside Bar as useful additions to make your Remek! Market Scanner Pro complete.